
Our solutions in tax, compliance, and business consulting to help you achieve financial clarity, streamline operations
Our solutions in tax, compliance, and business consulting to help you achieve financial clarity, streamline operations
RAM analysis is a comprehensive engineering methodology that quantifies system performance and predicts operational capability throughout an asset's lifecycle. This systematic approach evaluates how reliably equipment operates, how available it is for production, and how efficiently it can be maintained.
RAM analysis transforms design assumptions into quantifiable metrics, enabling data-driven decisions that optimize capital expenditure, reduce operational risk, and maximize asset performance across oil & gas, mining, power generation, and industrial sectors.
Comprehensive RAM studies demonstrating technical depth, quantitative rigor, and actionable insights that drive operational excellence and investment confidence
The Digital Risk Twin (DRT) transforms Operational Readiness (OR) by integrating design, risk, and operational data into a single digital model. This enables real-time, risk-based decision-making from concept through operations, ensuring that readiness, reliability, and performance targets are met across the full project lifecycle.
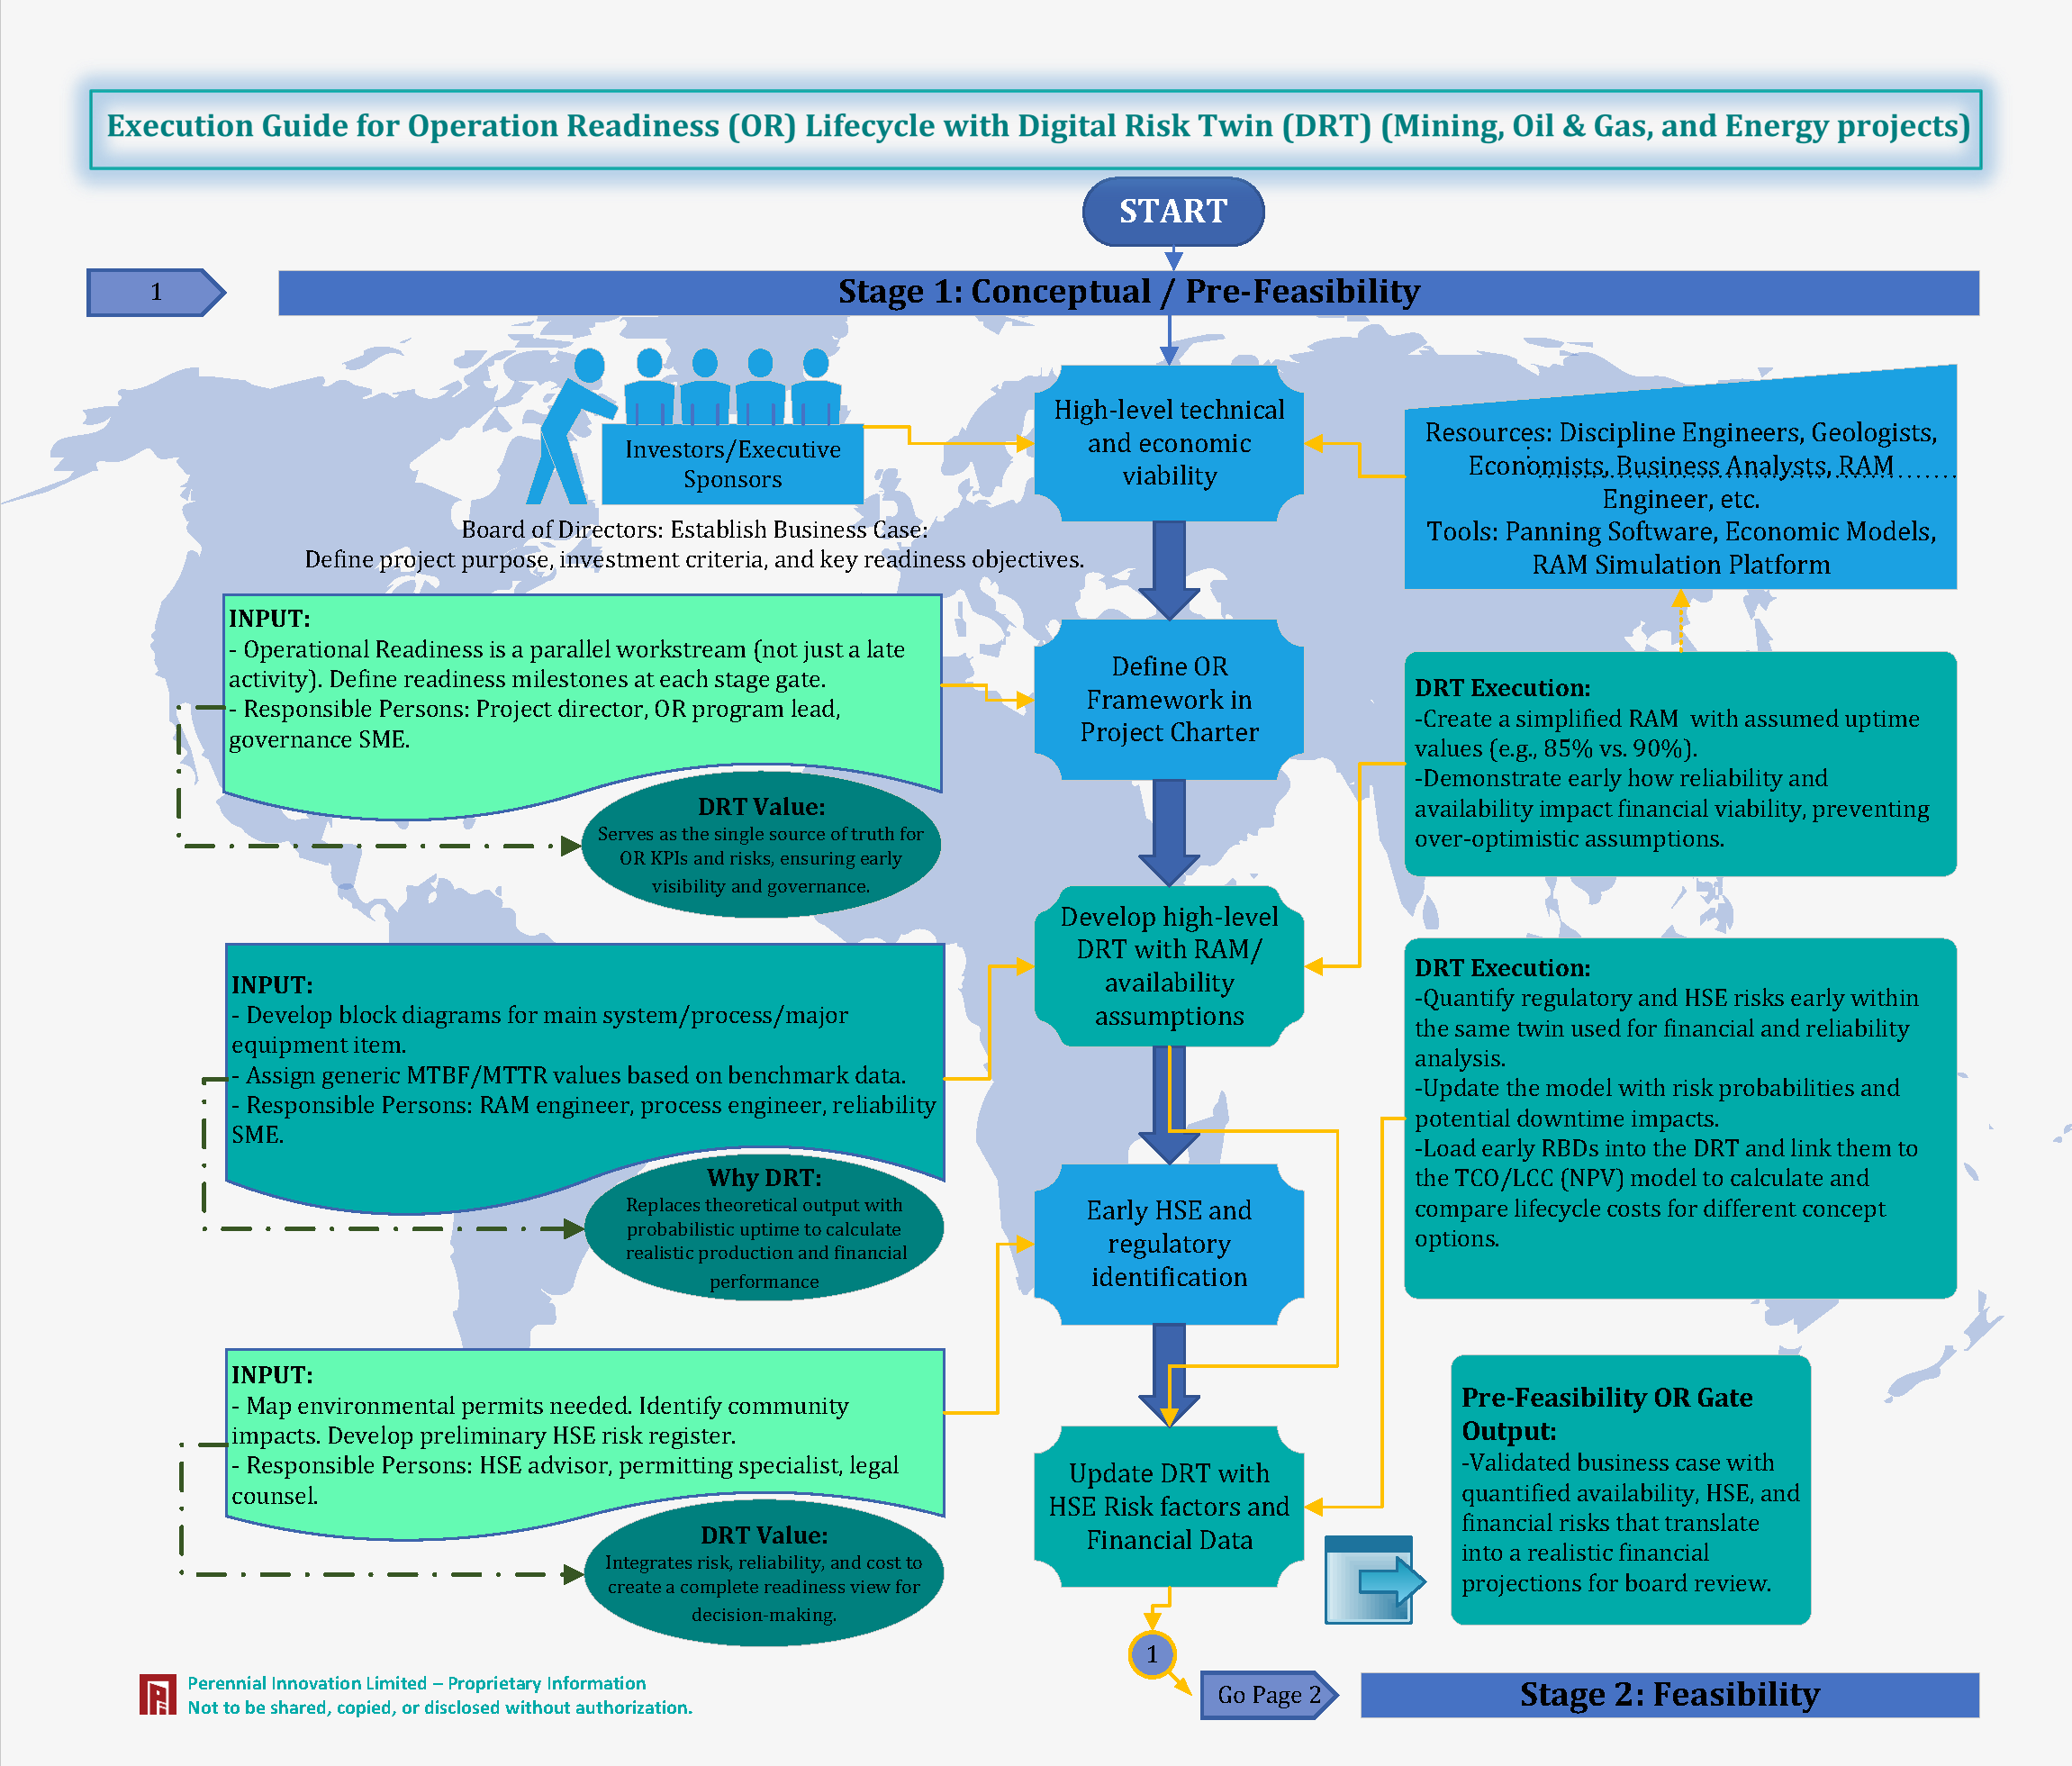
Stage 1: Concept & Pre-Feasibility Phase
The Board establishes the business case and defines investment criteria. High-level technical and economic viability is assessed.
We serve as the single source of truth for OR KPIs and risks, ensuring early visibility.
We replace theoretical output with probabilistic uptime to calculate realistic production and financial performance.
We create a simplified RAM with assumed uptime values (e.g., 85% vs 90%) to demonstrate financial viability early.
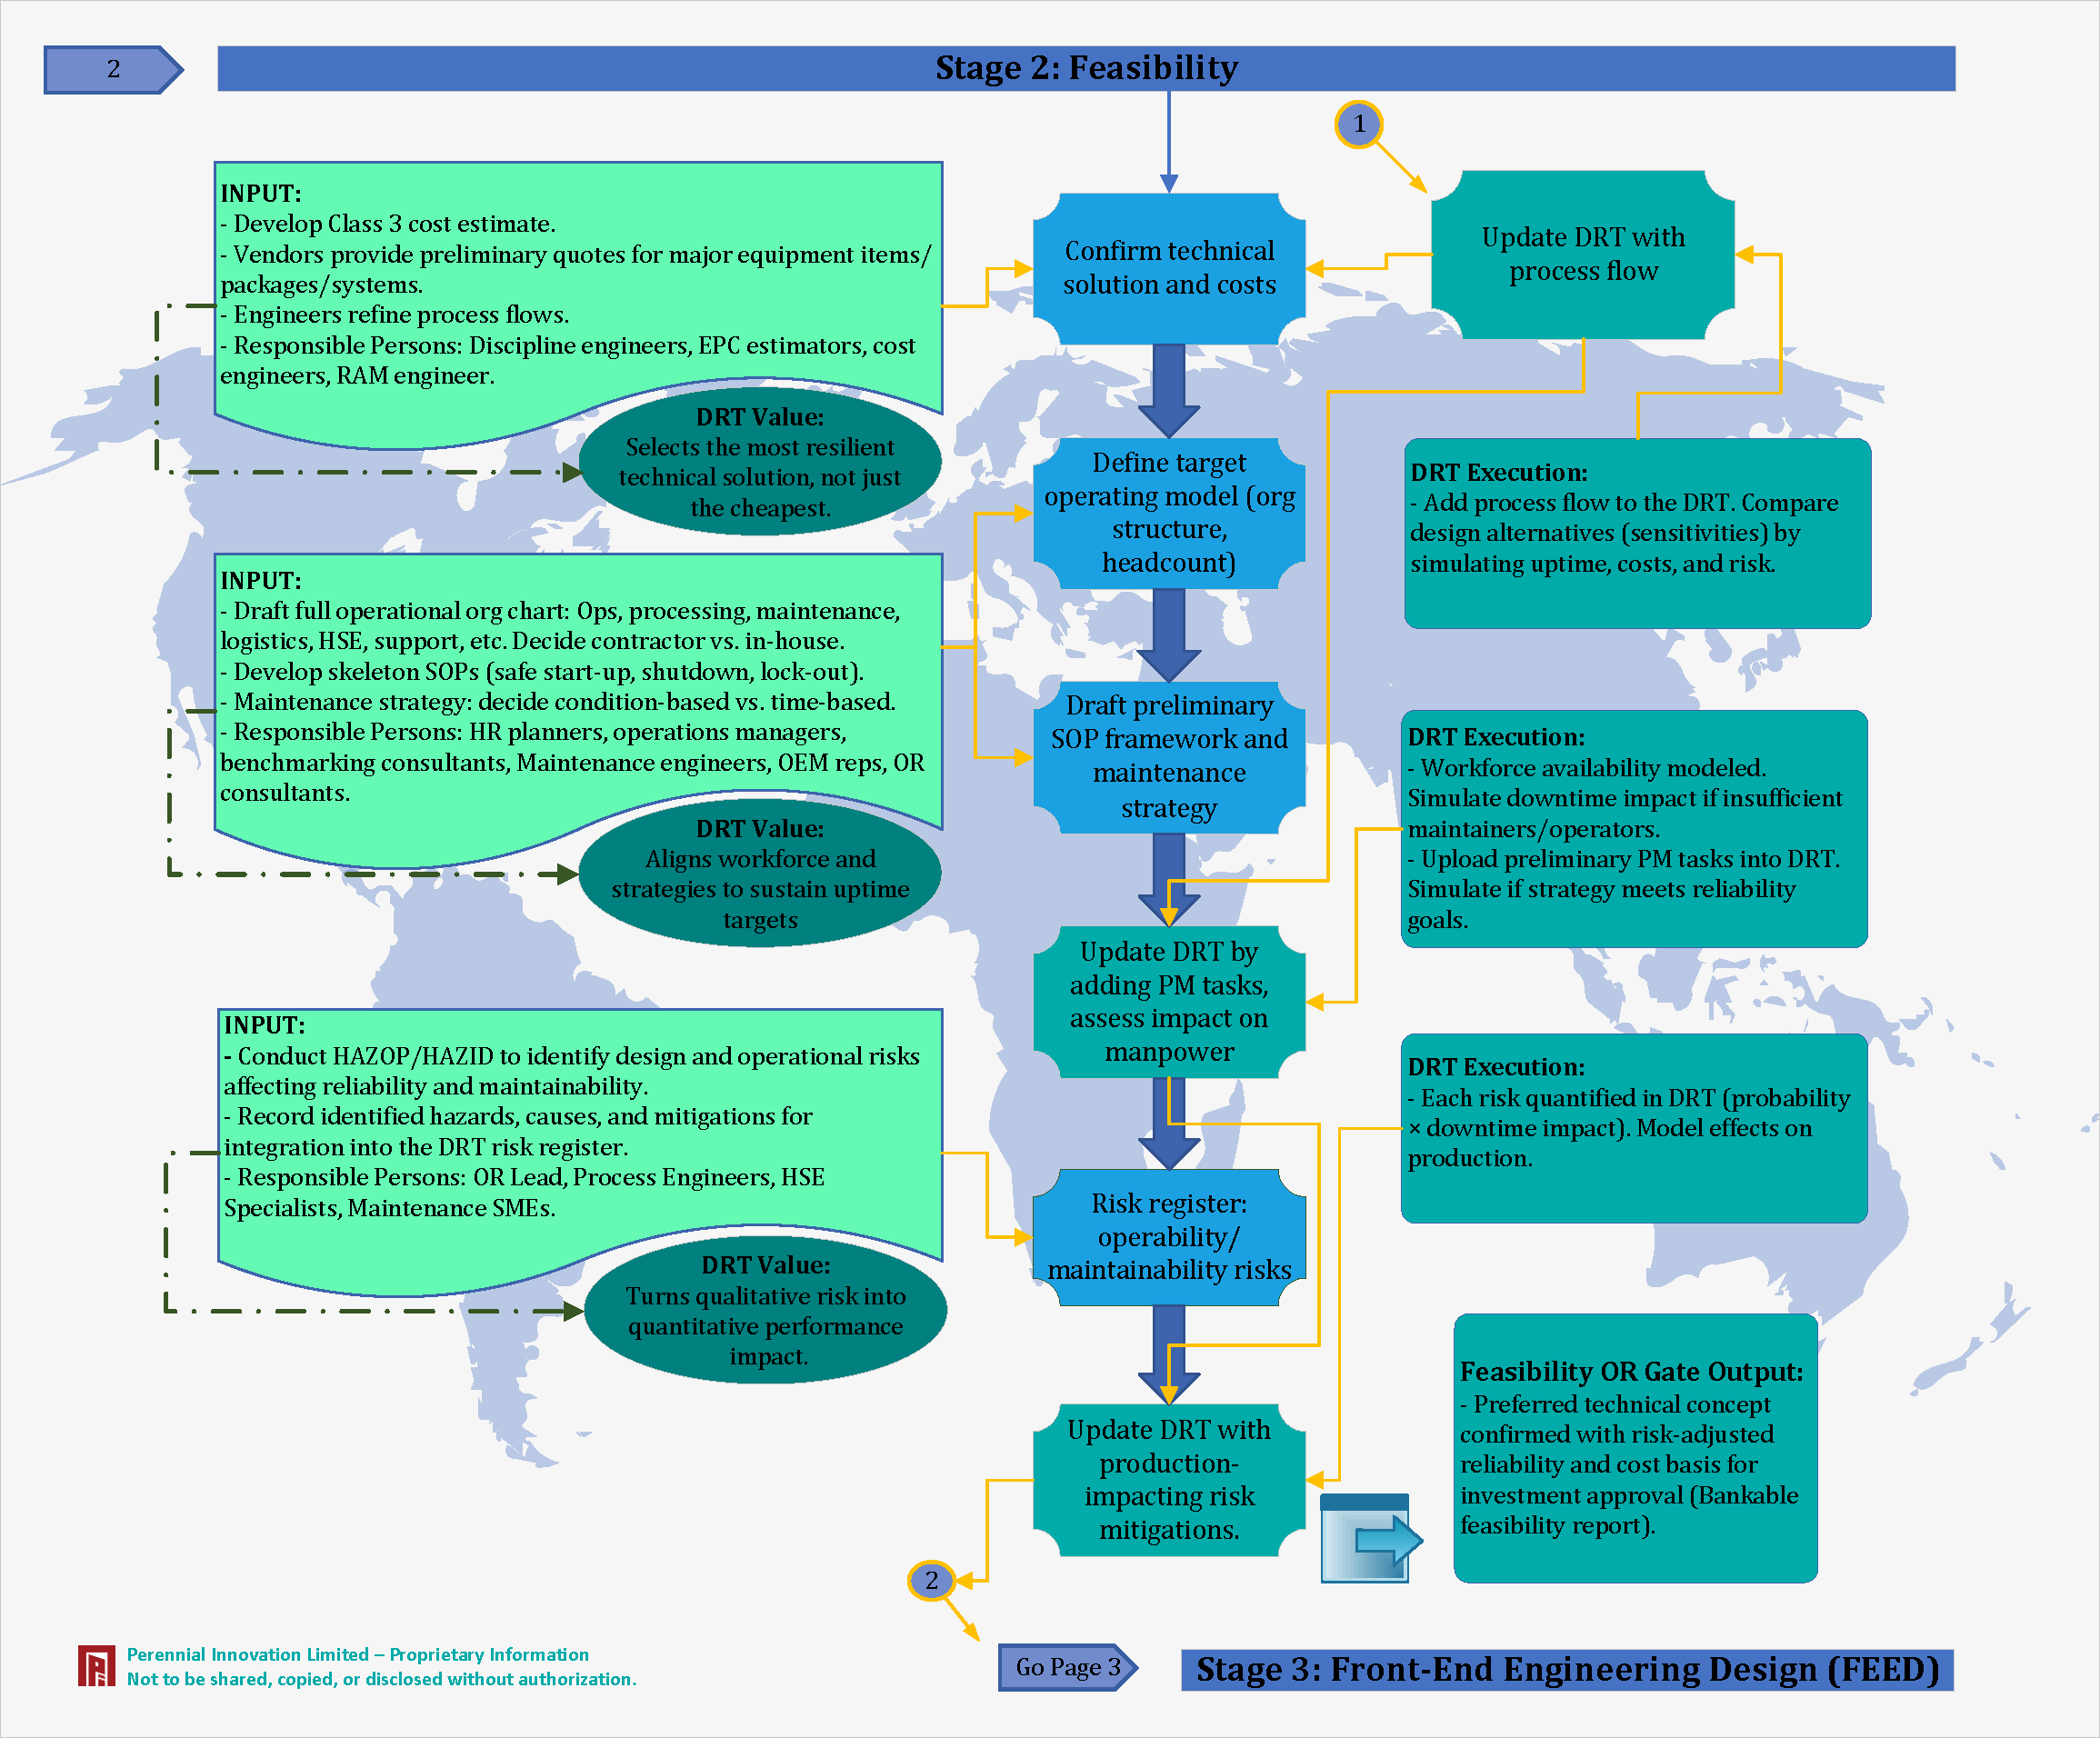
Stage 2: Feasibility Phase
Class 3 cost estimates are developed, and vendors provide preliminary quotes. Engineers refine process flows.
The DRT selects the most resilient technical solution, not just the cheapest one.
We align workforce strategies to sustain uptime targets by modeling manpower availability.
We turn qualitative risks (HAZOP/HAZID) into quantitative performance impacts.
Preferred technical concept confirmed with risk-adjusted reliability and cost basis for investment approval.
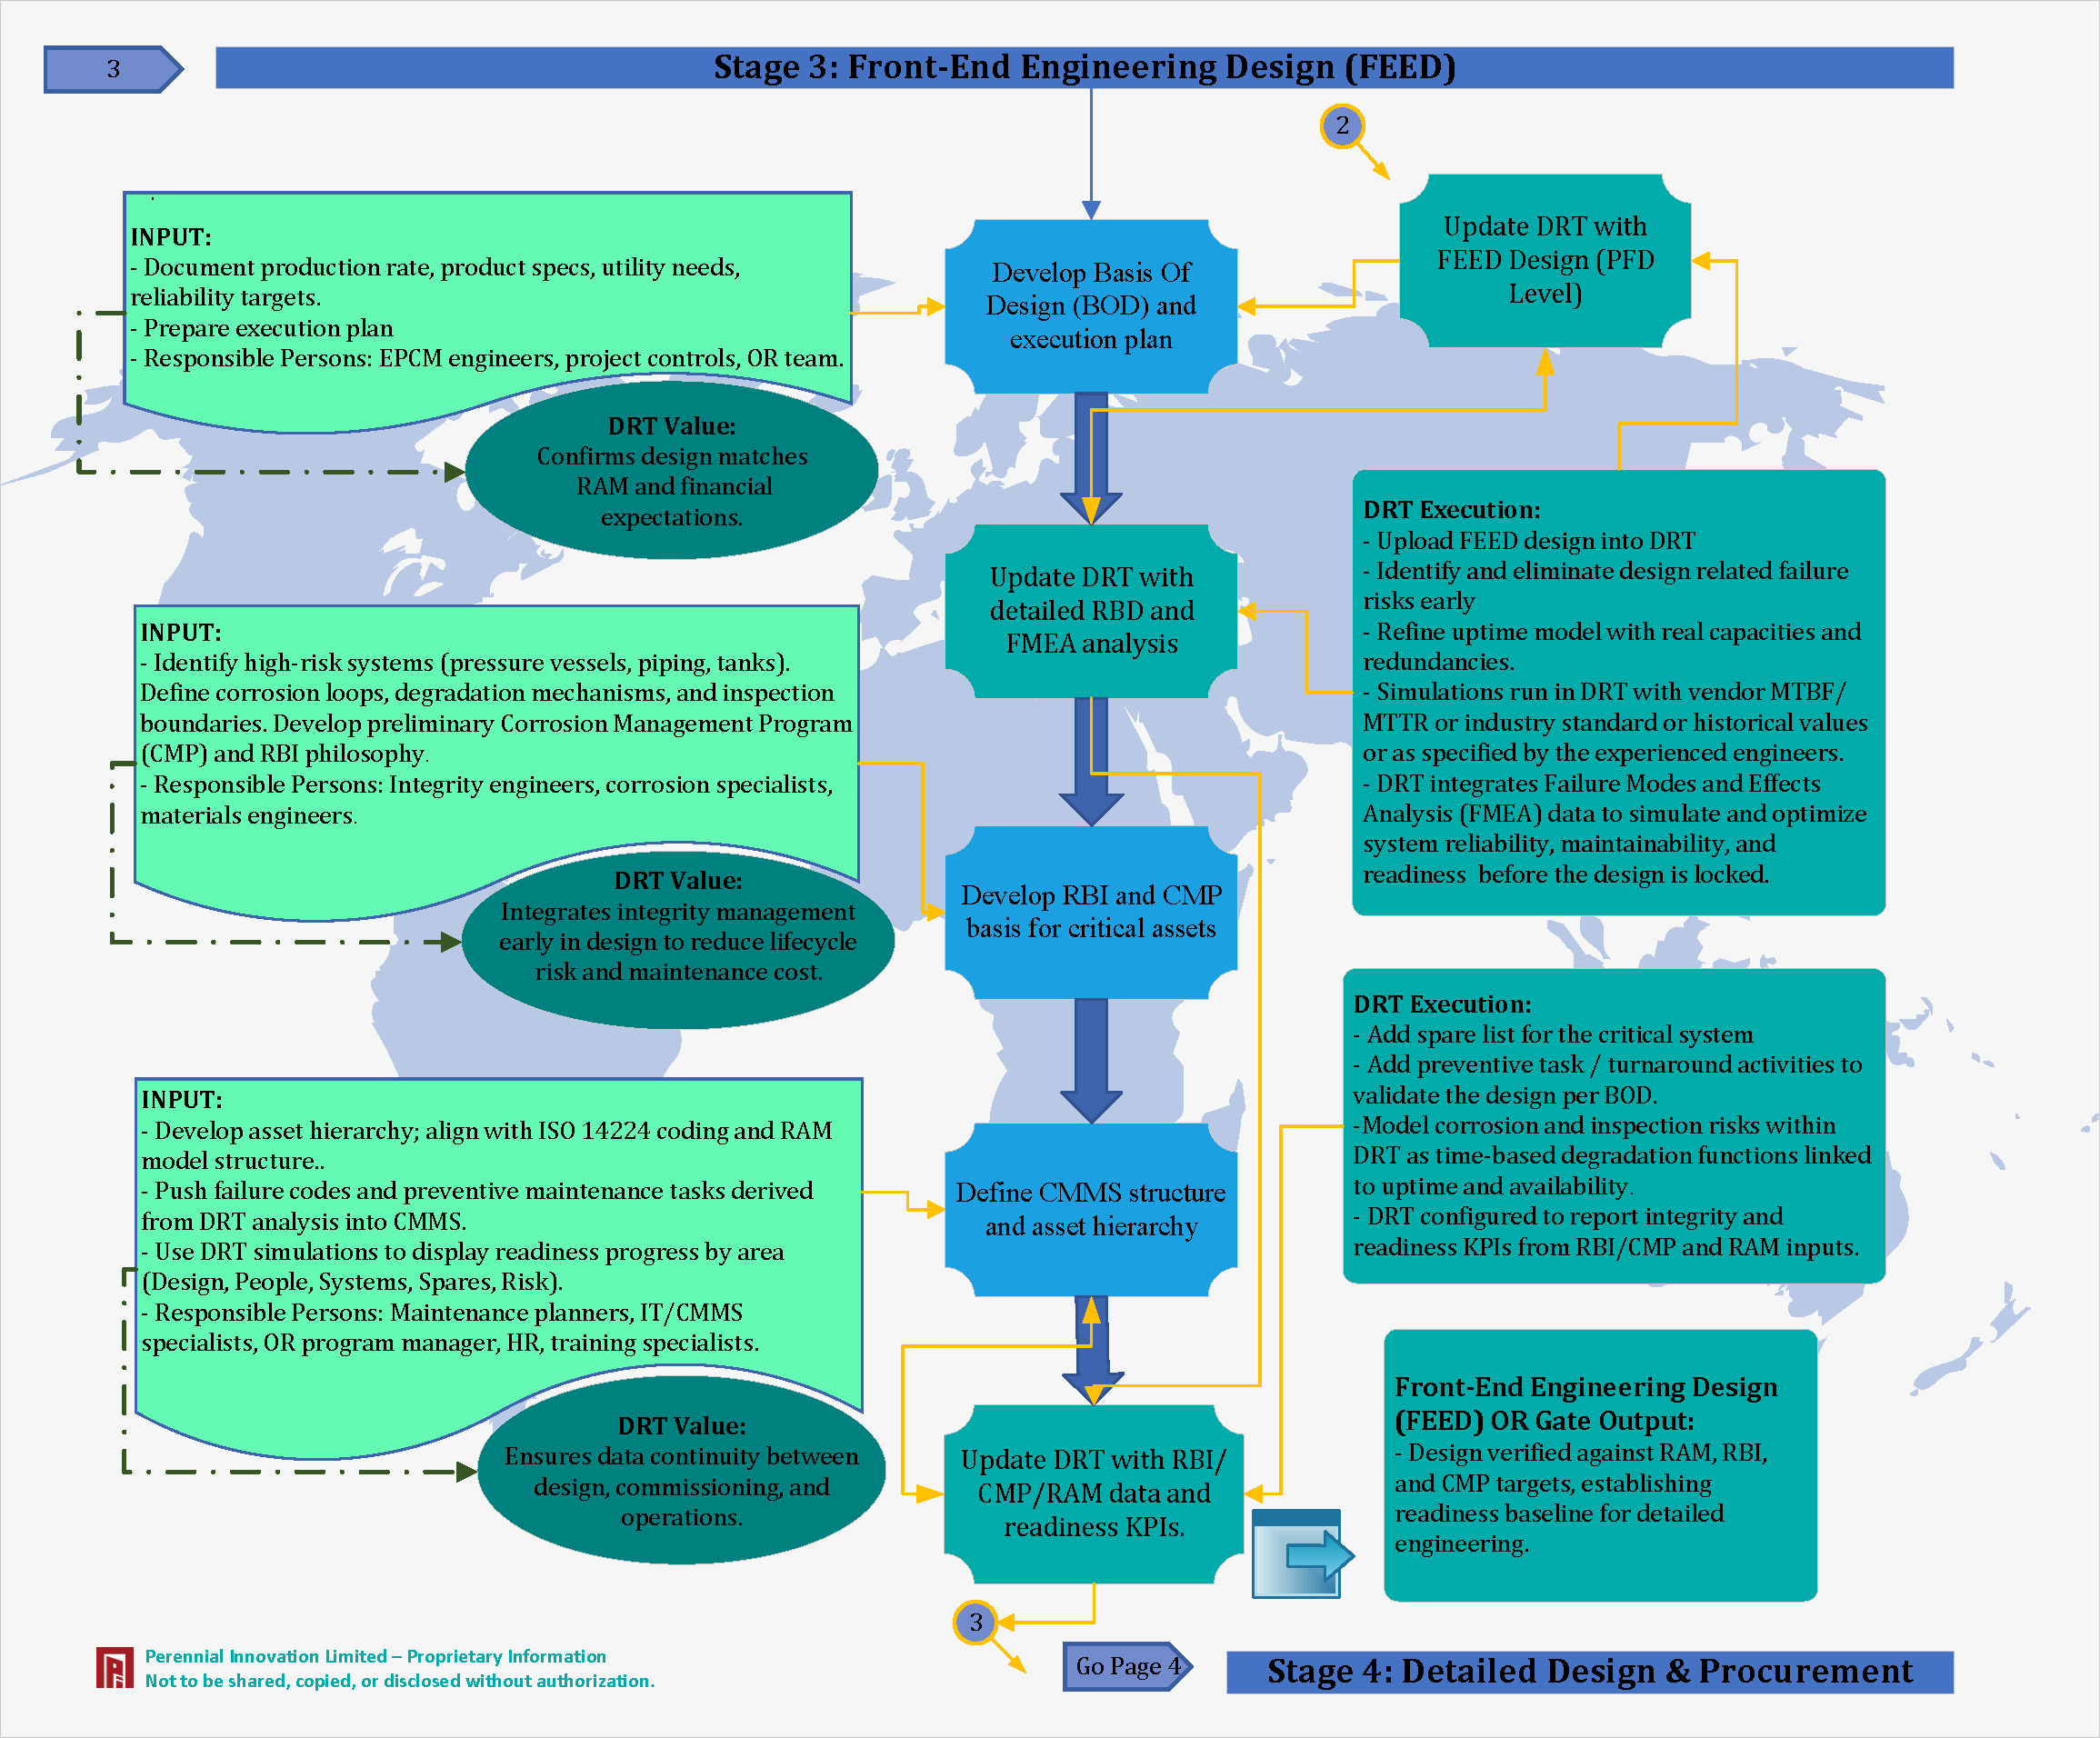
Stage 3: Front-End Engineering Design (FEED) Phase
Production rates and product specs are documented. High-risk systems (pressure vessels, piping) are identified.
The DRT confirms that the design matches RAM and financial expectations.
We integrate integrity management early to reduce lifecycle risk and maintenance cost.
We ensure data continuity between design, commissioning, and operations by integrating FMEA data to optimize system reliability.
Design verified against RAM, RBI, and CMP targets, establishing readiness baseline for detailed engineering.
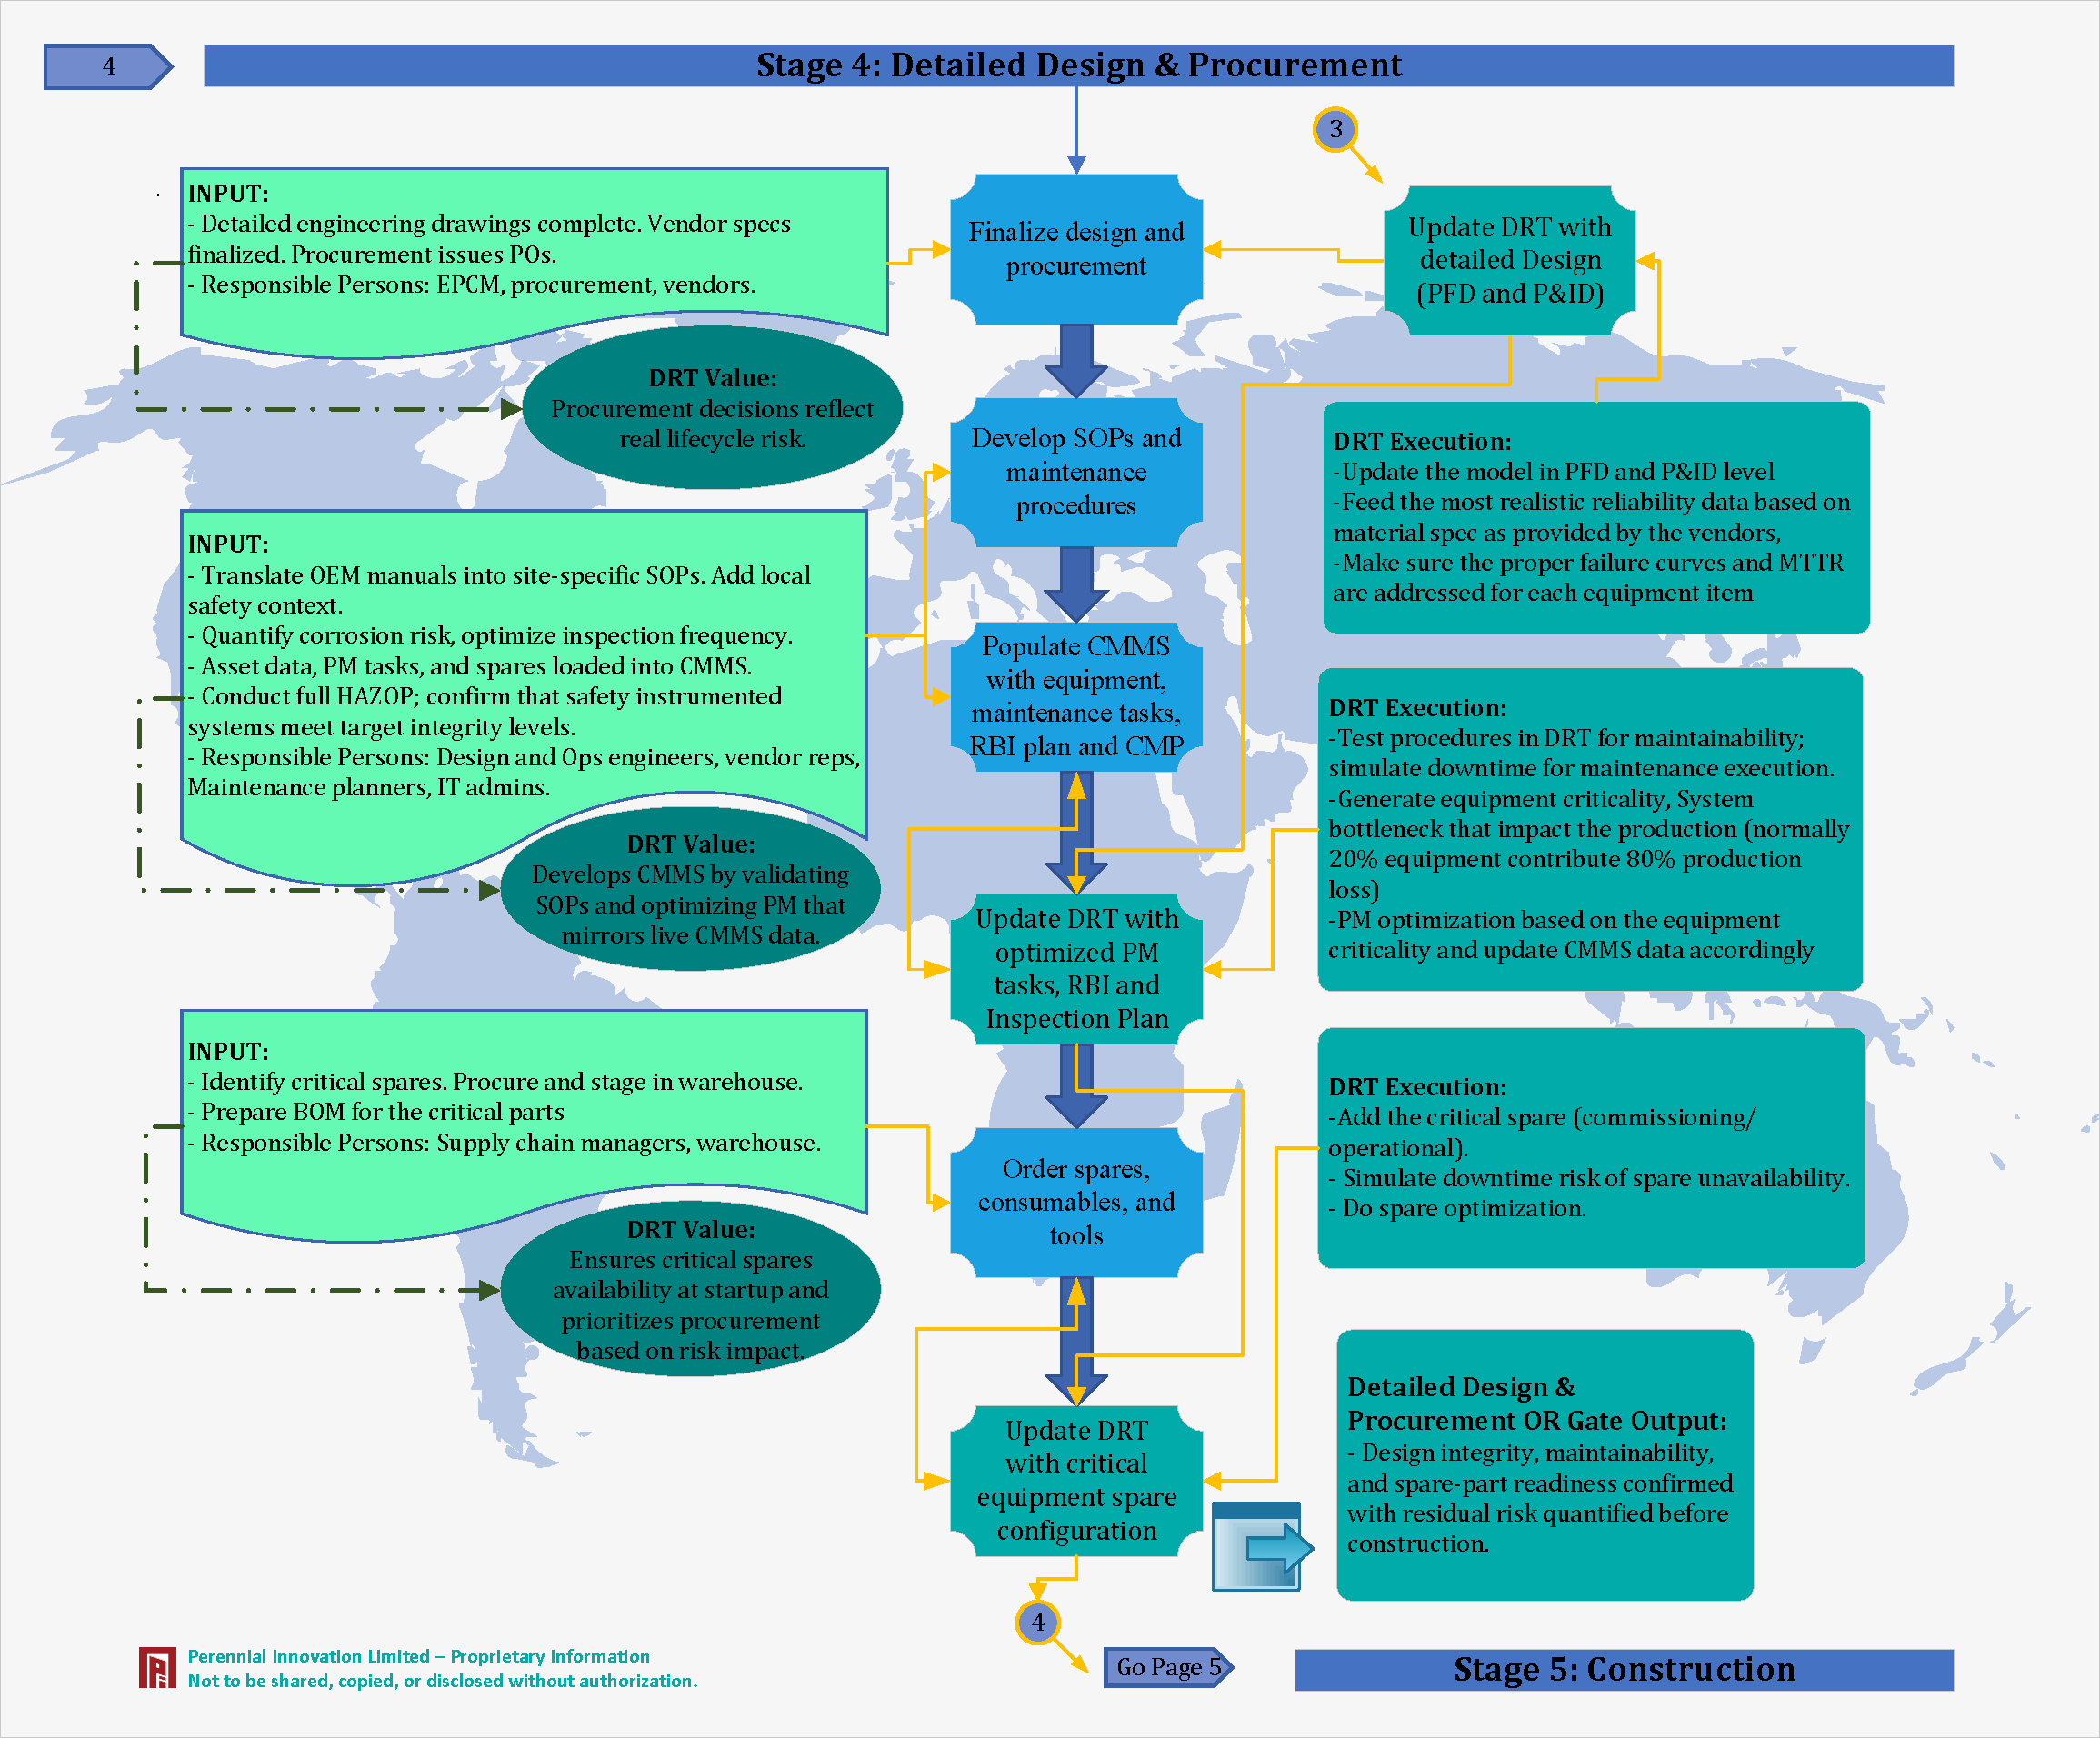
Stage 4: Detailed Design & Procurement Phase
Detailed drawings are completed, and procurement issues Purchase Orders. Critical spares are identified.
Procurement decisions reflect real lifecycle risk, not just upfront cost.
We develop the CMMS by validating SOPs and optimizing PM tasks that mirror live data.
We ensure critical spares availability at startup, prioritizing procurement based on risk impact.
Design integrity, maintainability, and spare-part readiness confirmed with residual risk quantified before construction.
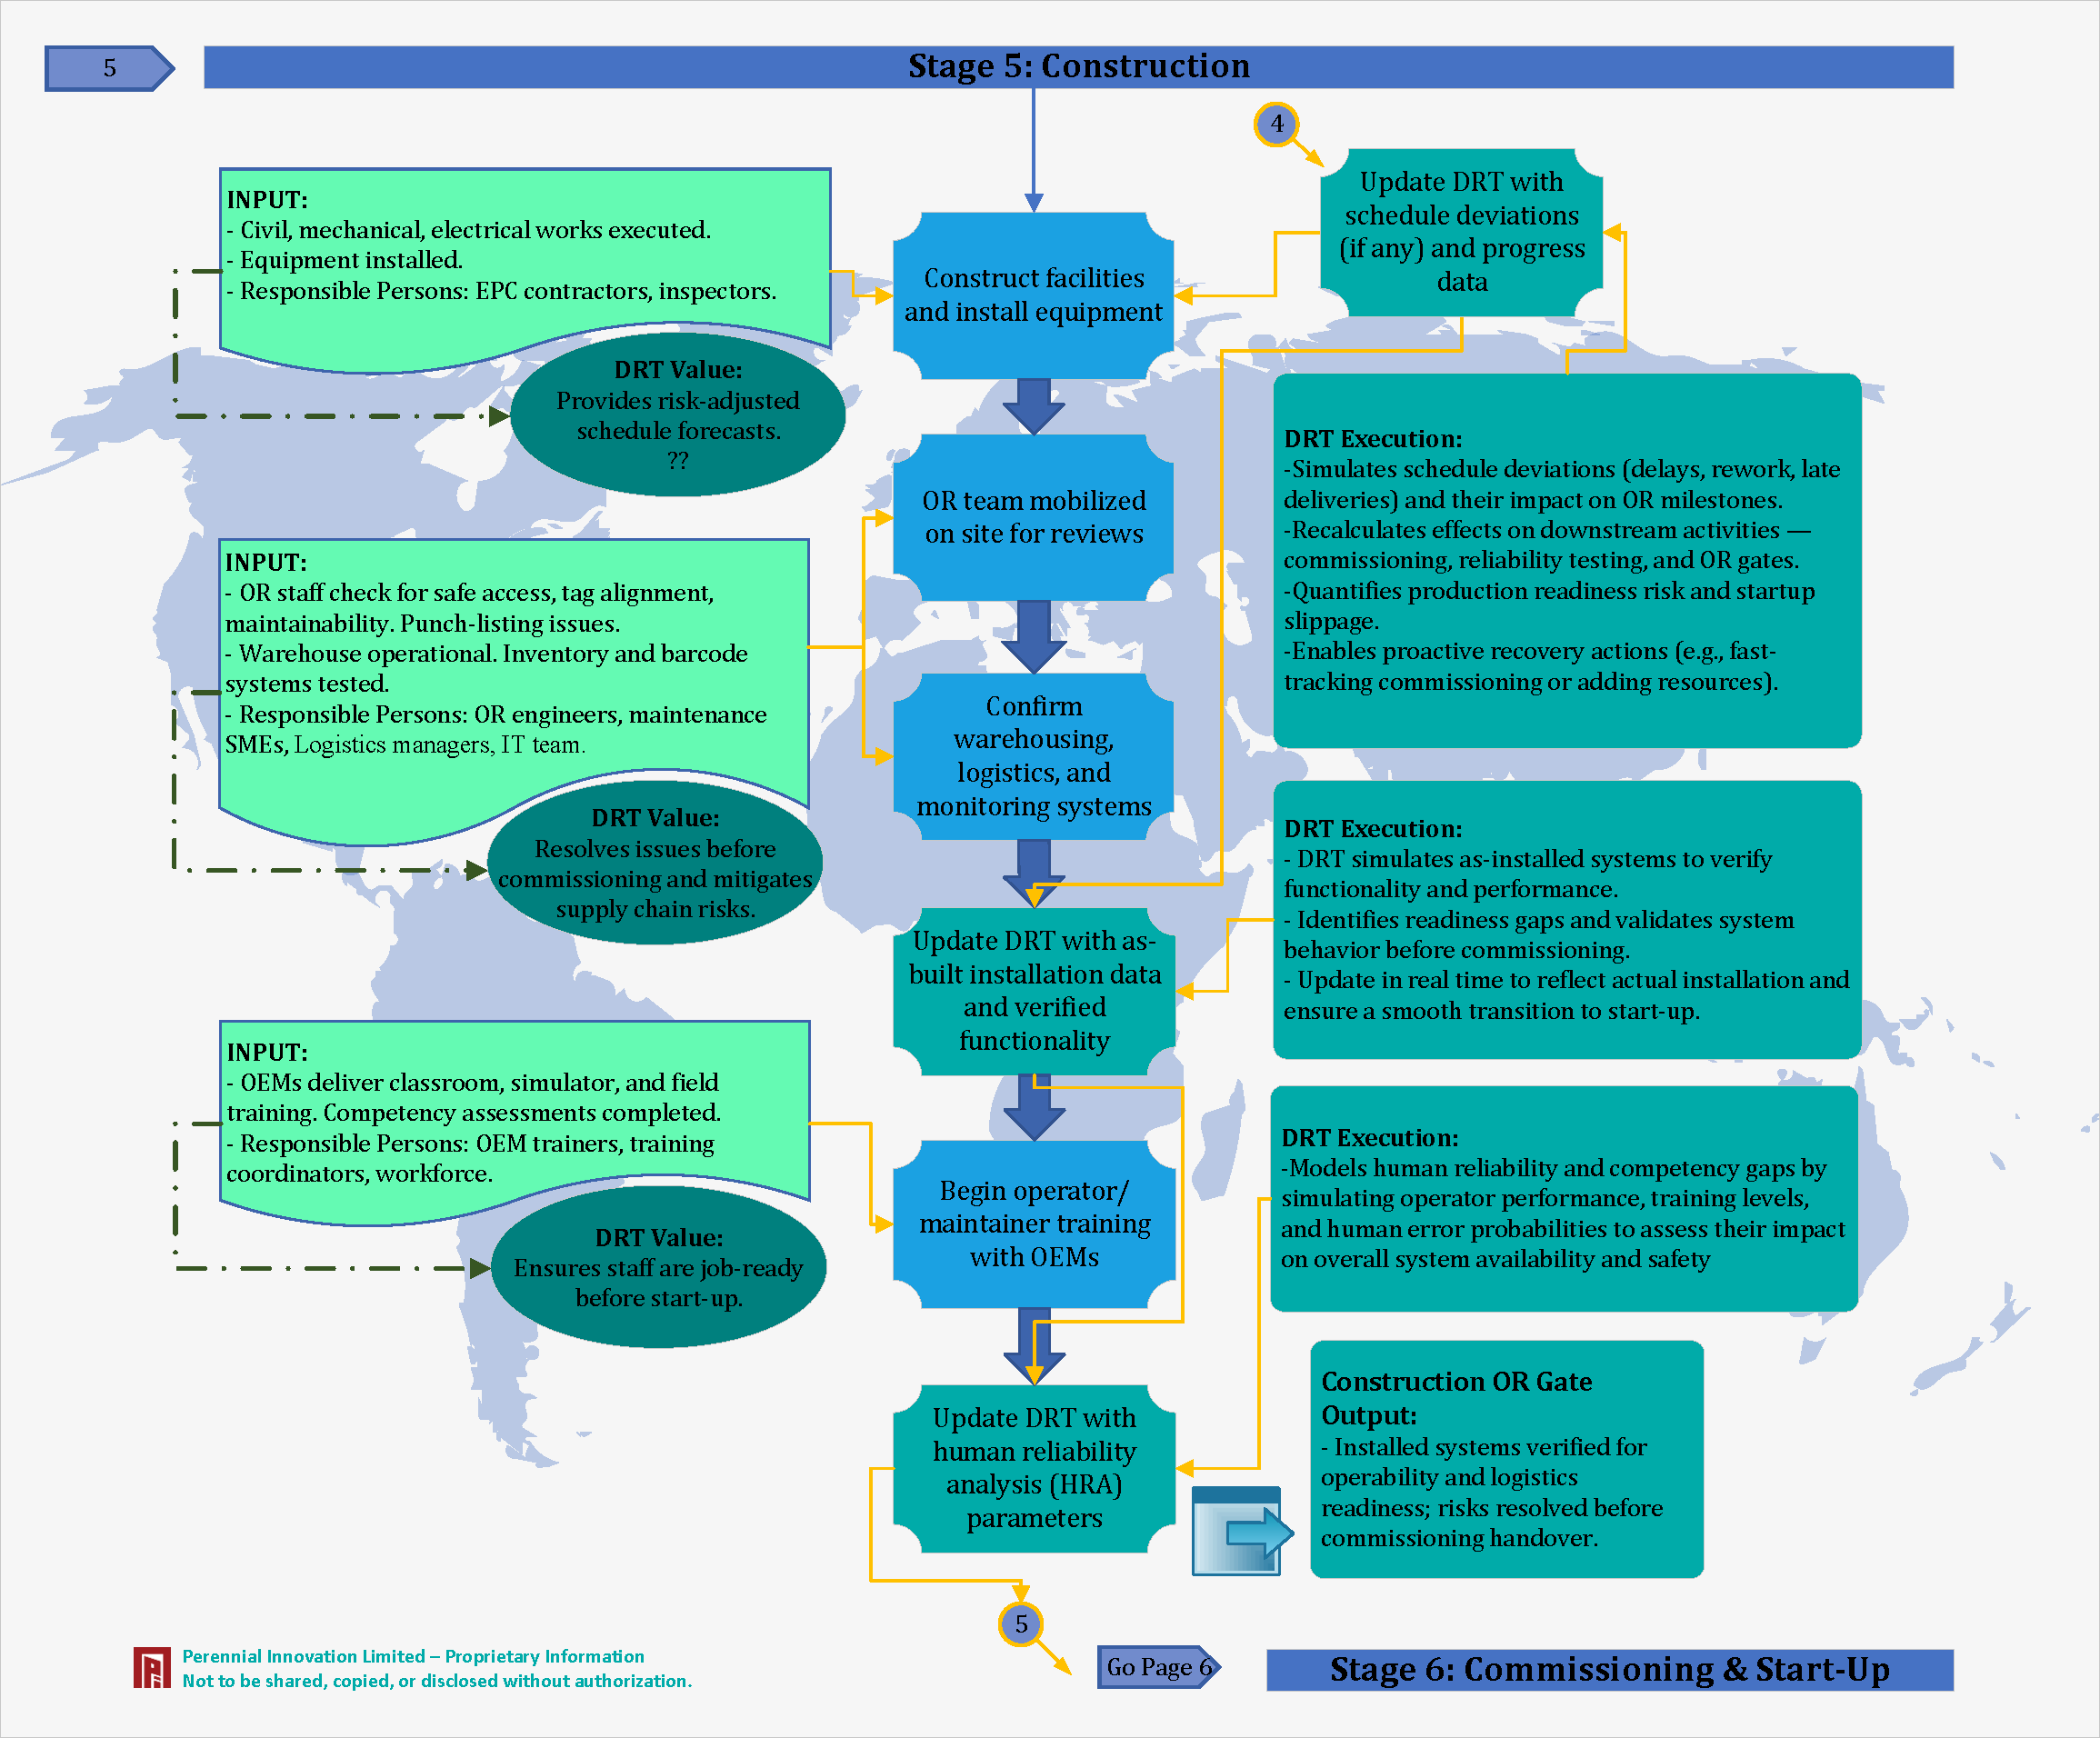
Stage 5: Construction Phase
Facilities are constructed, and equipment is installed. OR staff check for maintainability and safe access.
We provide risk-adjusted schedule forecasts, simulating delays and their impact on OR milestones.
DRT simulates as-installed systems to verify functionality and performance before commissioning.
We ensure staff are job-ready before start-up by modeling human reliability and competency gaps.
Installed systems verified for operability and logistics readiness; risks resolved before commissioning handover.
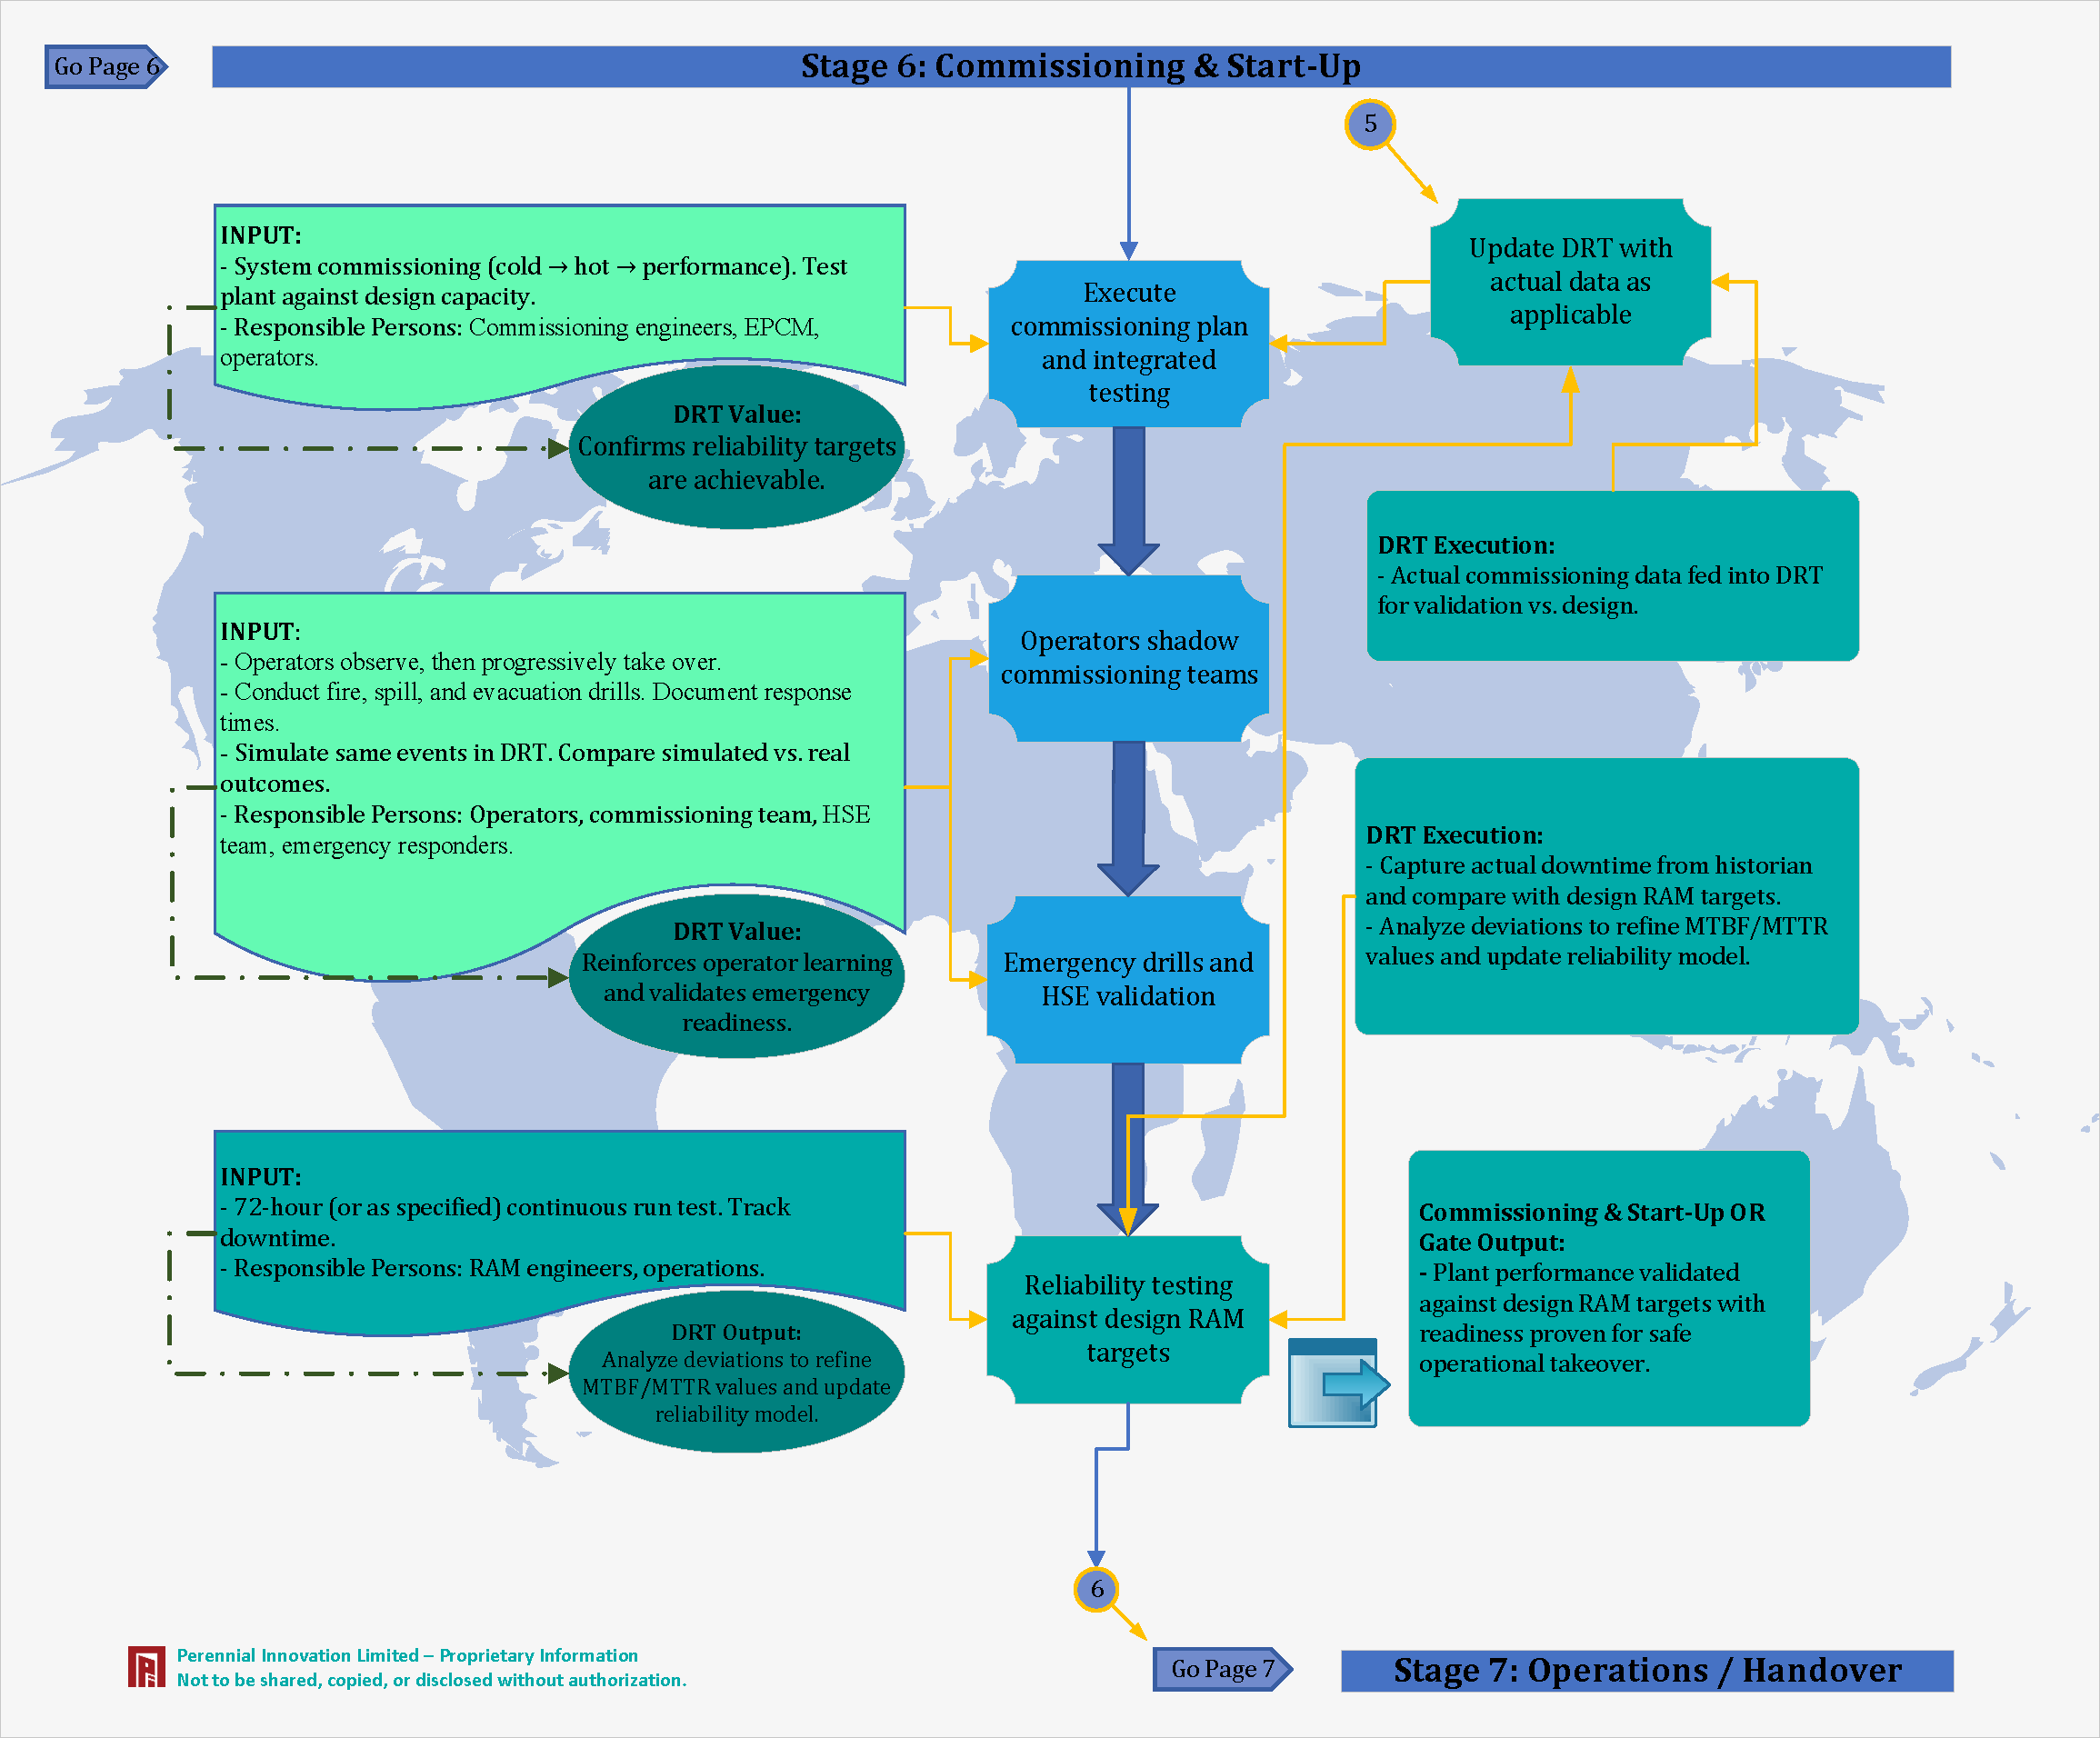
Stage 6: Commissioning & Start-Up Phase
System commissioning (Cold → Hot → Performance). Reliability testing against design RAM targets.
We confirm that reliability targets are achievable using actual commissioning data.
Actual commissioning data fed into DRT for validation vs. design. Capture actual downtime and compare with targets.
We reinforce operator learning and validate emergency readiness by comparing simulated events vs. real outcomes.
Plant performance validated against design RAM targets with readiness proven for safe operational takeover.
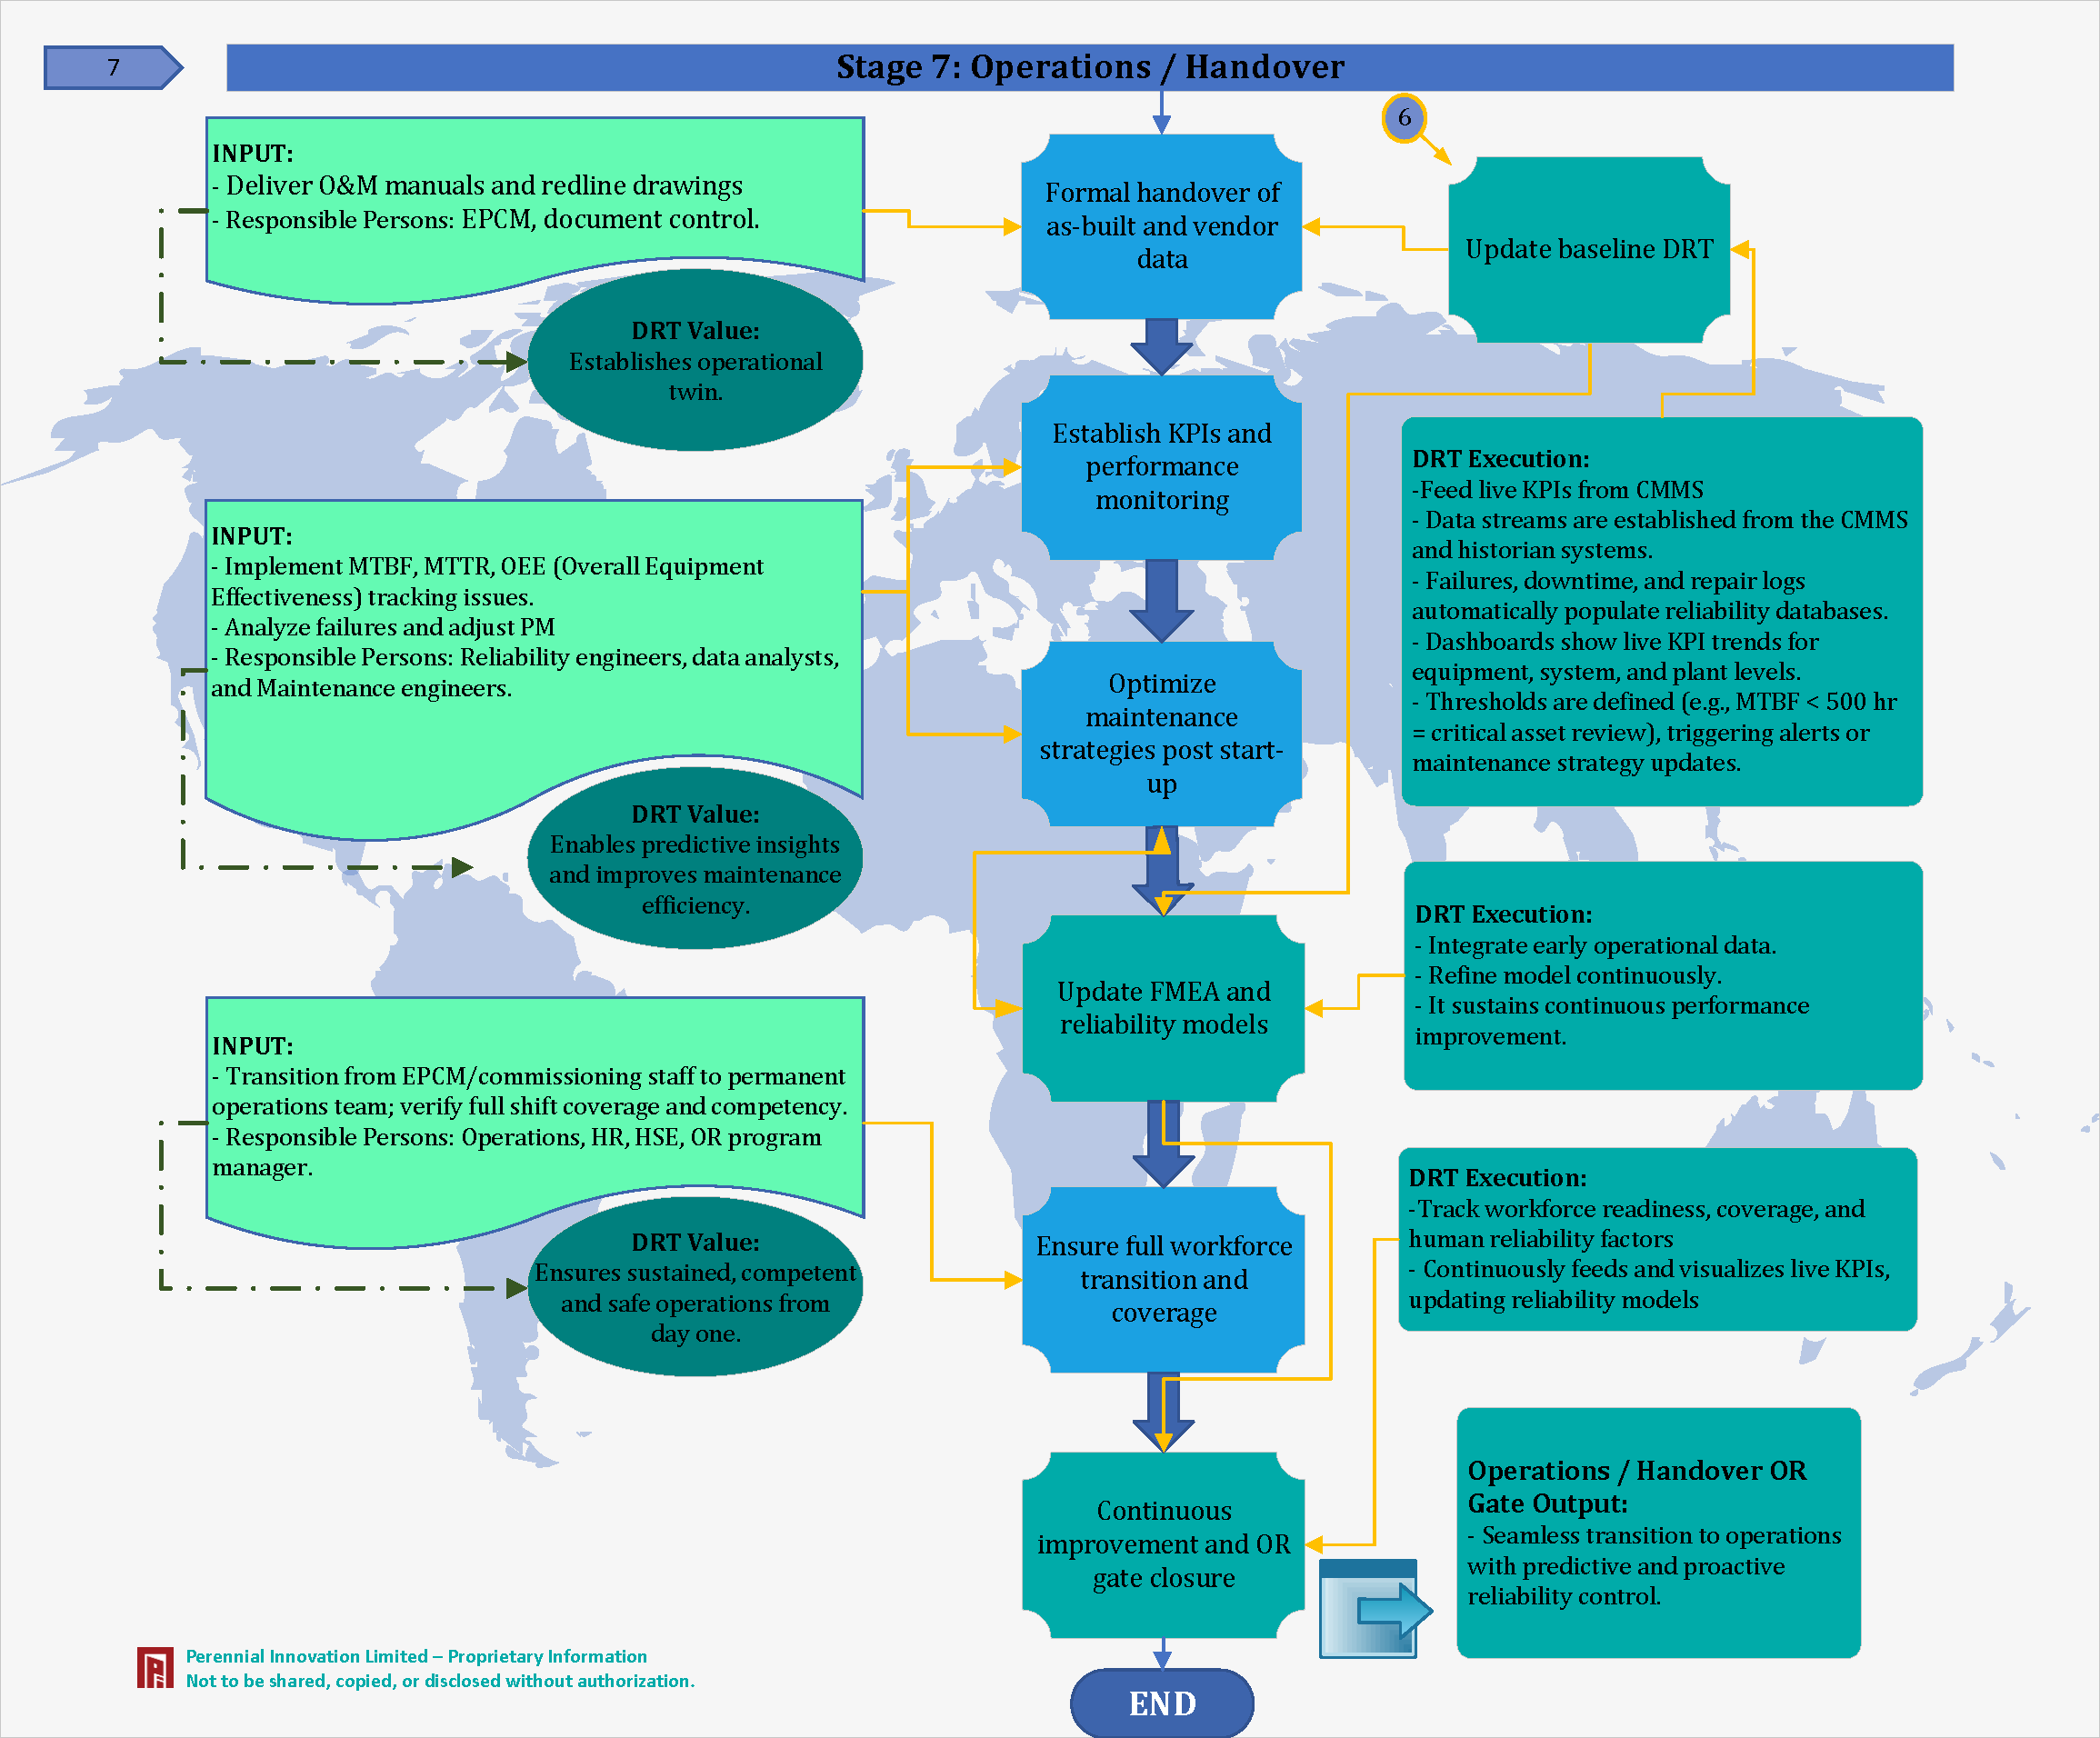
Stage 7: Operations / Handover Phase
Formal handover of as-built data. Transition to permanent operations team.
We establish an operational twin that enables predictive insights and improves maintenance efficiency.
Feed live KPIs from CMMS. Data streams from historian systems populate reliability databases and dashboards automatically.
Integrate early operational data, refine model continuously to sustain performance improvement.
Seamless transition to operations with predictive and proactive reliability control.
In asset-intensive industries, unplanned downtime can cost millions. Traditional engineering approaches often rely on conservative assumptions and over-specification, leading to:
RAM analysis addresses these challenges by providing quantitative evidence that design configurations meet operational requirements before construction begins.
Definition: The probability that equipment will perform its intended function without failure over a specified period.
Key Metrics:
Definition: The proportion of time that equipment is capable of performing its intended function when required.
Key Metrics:
Definition: The ease, speed, and cost with which maintenance can be performed to restore equipment function.
Key Metrics:
Establish the analytical foundation through comprehensive data gathering and system boundary definition. Review P&IDs, gather historical failure data, and define RAM targets.
Create logical representation of system reliability structure showing component interdependencies, redundancy configurations, and operational states.
Populate RAM models with statistically validated failure and repair parameters using historical data and industry databases.
Execute Monte Carlo simulations (10,000+ iterations) to quantify system reliability, availability, and maintainability metrics.
Rank equipment based on contribution to production loss, enabling risk-based decision making and spare parts optimization.
Communicate findings and provide actionable recommendations for design optimization and risk mitigation.
Upstream: Offshore platforms, subsea systems, Oil Sand, SAGD and onshore processing facilities.
Midstream: Pipeline systems, compressor stations, and gas processing plants.
Downstream: Refinery units, hydrogen plants, and sulfur recovery systems.
Extraction: Underground equipment, open-pit hauling, conveyor networks, and crushing circuits.
Processing: Beneficiation facilities, concentrators, smelters, and tailings management.
Infrastructure: Power generation, water treatment, and material handling.
Thermal: Coal, gas, and biomass-fired generation facilities including turbines and generators.
Combined Cycle: Gas turbine generators and heat recovery steam generators.
Renewable: Wind farms, solar facilities, and battery storage systems.
Process Units: Ethylene crackers, polymerization reactors, and distillation columns.
Utilities: Steam systems, cooling water, compressed air, and nitrogen generation.
Pharmaceuticals: Cleanroom facilities, bioreactors, and purification systems.
25+ years specialized experience, 50+ RAM studies completed. Expert proficiency in advanced simulation and modeling tools. Comprehensive understanding across diverse industries.
Integrated analysis approach combining FMEA, RBI, and lifecycle cost. Digital Risk Twin (DRT) framework. Multi-phase support from concept through operations.
Practical, implementable recommendations beyond reports. Risk-based prioritization focusing resources on greatest availability improvements. Implementation support available.
Collaborative methodology with project engineers and operations teams. Transparent communication for diverse audiences. Flexible engagement models scalable to client needs.
Optimal Timing: During FEED phase for maximum design optimization value.
Decision Triggers:
Phase 1 - Planning: 1-2 weeks
Phase 2 - Modeling: 2-4 weeks
Phase 3 - Simulation: 1-2 weeks
Phase 4 - Reporting: 1-2 weeks
Total Duration: Typically 5-10 weeks for FEED-phase studies, scalable based on complexity.
ROI: Typical return of 5-100x on study investment through prevented failures and optimized designs.
Traditional reliability engineering uses deterministic calculations and safety factors. RAM analysis employs probabilistic Monte Carlo simulation capturing full system behavior and providing quantitative availability predictions.
Models using site-specific data typically predict availability within ±2-3%. Models using generic industry data have wider uncertainty (±5-10%) but still provide valuable design insights.
Absolutely. Operational RAM studies identify reliability bottlenecks, optimize maintenance strategies, evaluate upgrades, and benchmark performance. Historical data produces highly accurate models.
We utilize industry-standard databases (OREDA, IEEE 493, NPRD) containing reliability data for thousands of equipment types. Generic data adjusted for application context provides reasonable accuracy.
ROI varies but is typically 5-100x. A $75,000 study identifying $3M redundancy optimization or preventing $1M/year production losses delivers substantial value.
Leading Consultants for RAM Analysis and Asset Integrity
© 2016 Perennial Innovation Limited. All rights reserved.